What Is Business Analytics?
Category : Background
The term “data” has become ubiquitous with companies like Google, Amazon, and Facebook. They mastered the art of extracting usable information from massive amounts of messy, unstructured data. Google always seems to know what you want to search for and Facebook always seems to suggest you friend that new person that you just met. None of this would be possible without these companies and many other collecting and using data they obtain from you. Without data Google would not be able to push their ads to specific demographics, Amazon would not be able operate as efficiently and always show you something else you may want to purchase, and Facebook would be nothing more than a collection of photos. These companies, among hundreds of others, have exploited data through analytics; they understand and utilize the data to capitalize on it as much as possible. This quick emerging field of analyzing data was relatively unknown a little over a decade ago, businesses understood that analyzing data was important but not to the extent that it is today.
There is now an ever-growing need and demand for data and intelligent human resources to utilize these great data sets. Many universities, including Benedictine University, have recognized the potential in business analytics and quickly jumped into the game to develop and competitive master’s program to educate and push analytical students into a strong and prosperous career. However, this field has grown so fast that there are limited concrete terms that students and companies can use. This lack of set terminology causes confusion among many within the field and those who are interested in pursuing a career in it. How is a data analyst different from a data scientist? Is business intelligence the same thing as business analytics? What is the future of business analytics? These questions among many others are slowly sorting themselves out as the time passes and business analytics grows up and matures into a necessary aspect of the working world.
Business Analytics – Defined
Without an analyst to organize and manipulate data there would not be any reports or analysis on companies, school rankings, car reliability, etc. Someone had to take numbers and text and make something out of it. Dan Rachlis, a Specialist Master at Deloitte Consulting has stated, “Business analytics is the practice of using data to drive business strategy and performance” (Rachlis, 2013). Such a simple and clean definition, but nothing more is needed to hit at what business analytics is at its core. He does further this statement however, by explain that “by combining data, statistical analysis and predictive modeling, business analytics enables more accurate, objective and economical decision making” (2013). Lucky for Benedictine students and other eager students who jumped on the analytical bandwagon, Rachilis tells us that the changes that will take place over the next few years is not just going to be a short-term increase of analytical but that it will severely transform and disrupt how companies and analysts utilize data (Rachlis, 2013).
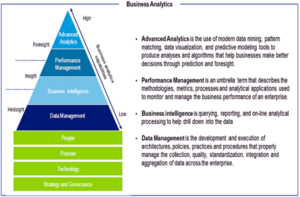
New tools and software are just as important to invest in as it is investing in competent employees. These tools allow for greater usage and manipulation of the data to create deeper and more effective analysis and predictions. Freely available and very popular software packages include R and Python, but many others exist to aid a business analyst in the pursuit of crafting the perfect report. Rachlis states, “the amount of data that is generated in the business world is doubling every year. Information from devices, machines and social media creates an entirely new set of challenges, and reinforces the fact that data will continue to grow exponentially for the foreseeable future” (Rachlis, 2013). This may strike fear in many analysts, just the shear mass of the data is close to incomprehensible, but a wise analyst will see opportunity from this. Rachlis provides a pyramid of business analytics that breakdowns the steps necessary from the base of the company up to the top of advanced analytics.

- Graphic taken from Rachlis, 2013
Rachlis writes, “To maximize the benefit of analytics, organizations need to go from the base of the pyramid to the top by combining the collective intelligence from all available sources available” (Rachlis, 2013). The pyramid provides fundamentals of business analytics really is and the complexity within it. One could easily argue that there are more than four tiers, but the different paths that each tier represents is undeniable, each leading to different realm of analytics.
Each tier explains a different segment of business analytics and a potential career path for a student in a master’s program or someone looking for a career change, each step progressing with more difficulty and a stronger analytical focus. The pyramid is the true base of understanding what business analytics/business intelligence/data science, whatever you want to call it, really is.
References
Rachlis, D. (2013, February). Business Analytics: What is the Future of Business Analytics. Retrieved May 04, 2016, from https://www.soa.org/News-and-Publications/Newslett